

"The first principle is that you must not fool yourself, and you are the easiest person to fool."
Cone of Possibilities
Designers use a similar process [2]. Mature designer have a structured way of thinking where he/she can visualize the different branches of exploration, forming a tree structure and with experience a mature designer has the discipline to know which branches to kill, and which to pursue further.
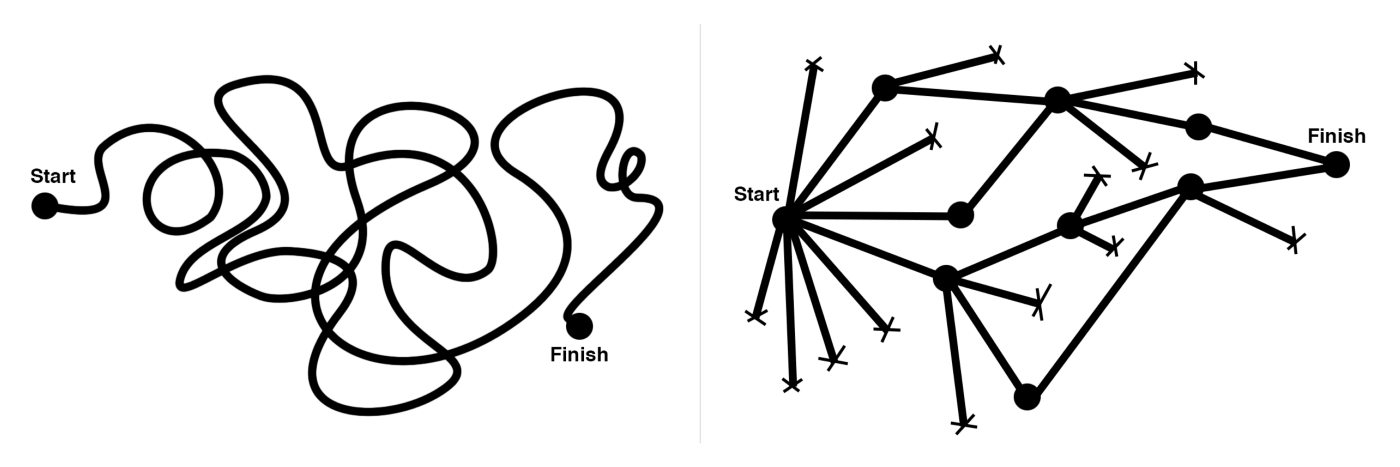
Traditional design process, pioneered by IDEO and the Stanford d.school.
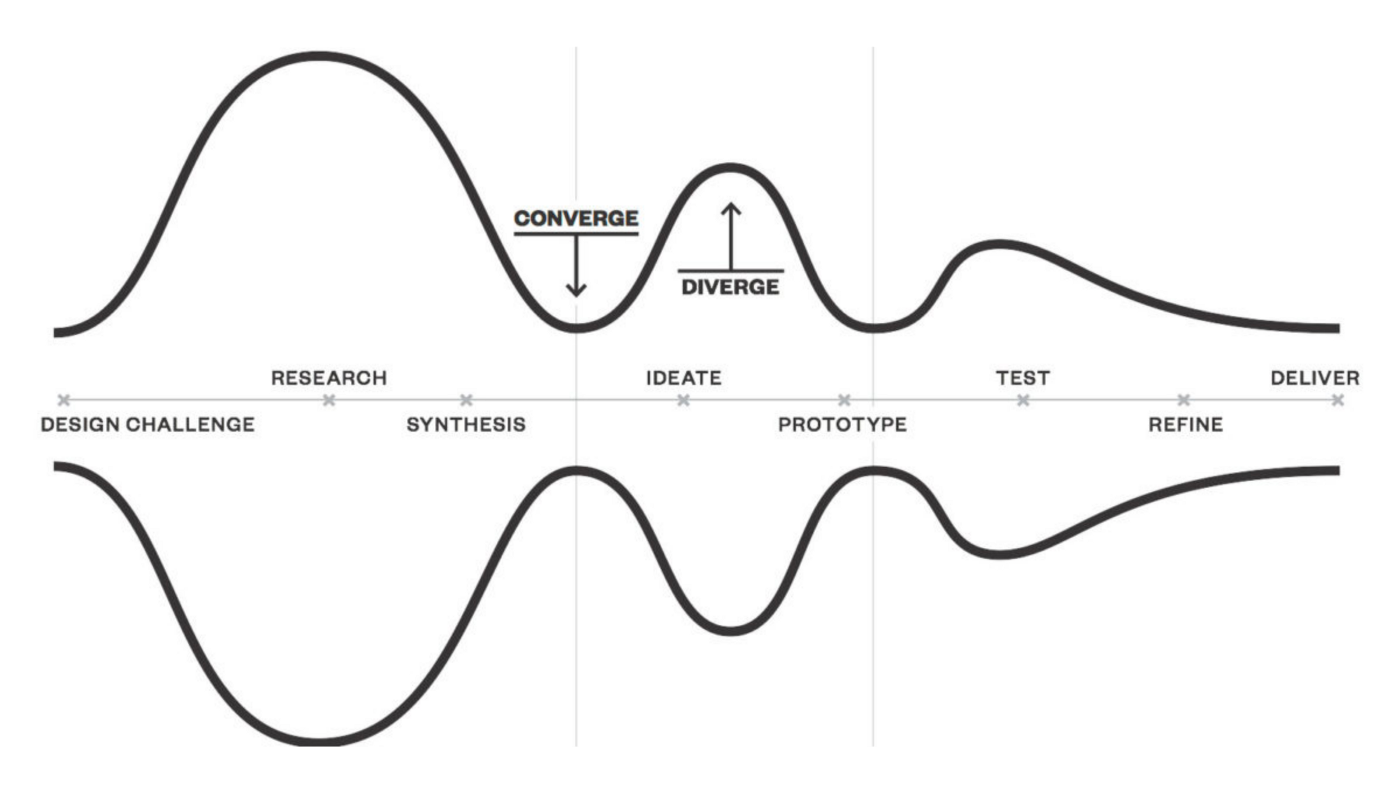
cone of possibility” that diagrams the ability to see multiple futures – such a key innovation process but one that is routinely ignored in most business settings.

2. Precision vs Recall
These terms were originally used in information retrieval. IR system returns a set of documents for a query.


Example: When a search engine returns 30 pages, only 20 of which are relevant, while failing to return 40 additional relevant pages, its precision is 20/30 = 2/3, which tells us how valid the results are, while its recall is 20/60 = 1/3, which tells us how complete the results are [4].
Implications: The advantage of having the two numbers for precision and recall is that one is more important than the other in many circumstances. Typical web surfers would like every result on the first page to be relevant (high precision) but have not the slightest interest in knowing let alone looking at every document that is relevant. In contrast, various professional searchers such as paralegals and intelligence analysts are very concerned with trying to get as high recall as possible, and will tolerate fairly low precision results in order to get it. Individuals searching their hard disks are also often interested in high recall searches. Nevertheless, the two quantities clearly trade off against one another: you can always get a recall of 1 (but very low precision) by retrieving all documents for all queries! Recall is a non-decreasing function of the number of documents retrieved. On the other hand, in a good system, precision usually decreases as the number of documents retrieved is increased. In general we want to get some amount of recall while tolerating only a certain percentage of false positives [3].
3. Limitations of Summary Statistics
"Scientific knowledge is a body of statements of varying degrees of certainty — some most unsure, some nearly sure, but none absolutely certain."
A visualisation is virtually always going to provide more information than a small collection of numbers like mean, variance, and other statistics about the data. We illustrate this idea with the following plot [1].
np.random.seed(0)
x = np.random.randn(2) + np.random.randn(1000,2) @ np.random.randn(2,2)
y = np.concatenate([np.random.randn(500,2) @ np.random.randn(2,2),
                    [4,4]+np.random.randn(500,2) @ np.random.randn(2,2)])

A = la.sqrtm(np.cov(x.T))
B = la.sqrtm(np.cov(y.T))
y = ((y - np.mean(y,0)) @ np.linalg.inv(B) @ A) + np.mean(x,0)
plt.scatter(*x.T)
plt.scatter(*y.T)
The following two distribution of points (one in blue and one in orange) have the same means standard deviations, and correlation.
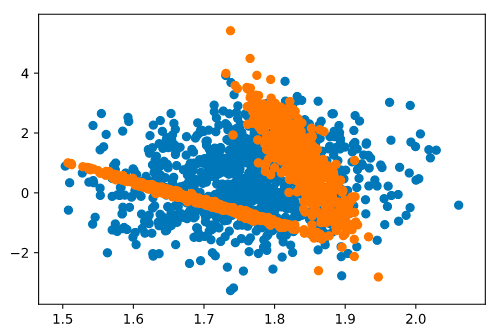
This is a mathematical property: since the x and y means, standard deviations, and correlation comprise just 5 numbers representing the data set, and since there are far more data points than this, by definition there will be an infinite number of (very different) data sets that share these same numbers. In fact, in this case, it’s trivial to perform an exact transformation that guarantees two datasets will have these same parameters, which is exactly what we did in the figure above (the code is there, but don’t worry if it’s not too understandable, we are just applying a linear transform to make the second distribution match the mean and covariance of the first exactly).
The point here is that despite the temptation to summarize dat using “simple” statistics, unless you have a good sense of the full distribution of your data (best achieved via visualization), these statistics can be misleading. People often assume “Gaussian-like” properties of data sets (more on Gaussian distributions later in the course), and when distributions are decided non-Gaussian, this can lead to a lot of misleading characterizations.
4. Bias vs Variance
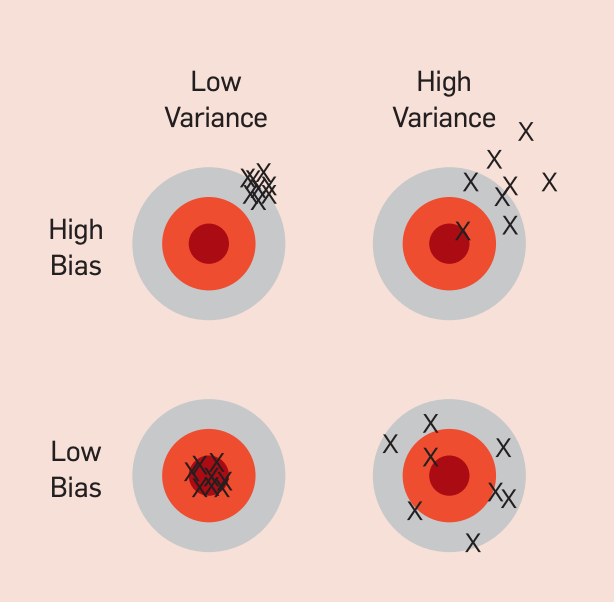
Bias:
Bias refers to the difference between the measure and some “true” value. A difference between an individual measurement and the true value is called an “error” (which implies the practical impossibility of perfect precision, rather than the making of mistakes). The bias is the average difference over many measurements. Ideally the bias of a measurement process should be zero
High Variance: When a learning algorithm outputs a prediction function g with generalization error much higher than its training error(i.e gap between the training error and test error is too large.), then it is said to have overfit the training data[2].
High Bias: Means the learning algorithm is underfitting the data. In practice we can look at the train set error and dev set error. If its not fitting the training set well (as shown by the train set error) then algorithm is said to have high bias. An algorithm can have both as well if the train set error is high and gap between train set and test set is high as well.
Since we are on the subject of bias, it Common cognitive biases
Common cognitive biases
- CONFIRMATION BIAS involves having the tendency to search for results that confirm your preconceptions while OBSERVATION BIAS The tendency to see what we expect (or want) to see in results.
- SELECTION BIAS: The tendency to select data for analysis that is not properly random.
- SAMPLING BIAS: (A type of Selection bias) The tendency to collect a sample of data in such a way that some members of the population are less likely to be included than others.
“All models are wrong, but some are useful”.
References: